
Businesses need timely, accurate information to track goals and respond to changing conditions. However, managing data across multiple departments can make it difficult to identify priorities and performance gaps.
Tools such as Microsoft Power BI, Tableau, and Looker help businesses organize key metrics for different teams. Building an effective dashboard starts with clear objectives, relevant KPIs, reliable data, and visuals that support everyday decisions.
What is a business intelligence dashboard?
A business intelligence dashboard is a visual interface that presents important business data through charts, graphs, tables, and key performance indicators (KPIs).
It can combine information from databases, customer relationship management (CRM) systems, financial software, and web analytics platforms. This helps teams monitor performance, identify problems, and measure progress toward business goals.
Dashboard data may update in real time, hourly, daily, or according to a scheduled refresh, depending on the data source and platform.
Business intelligence dashboards vs. business intelligence reports
BI dashboards and reports both support data analysis, but they serve different purposes.
- BI dashboards: Display important metrics and performance indicators in a visual format. Interactive filters and drill-down features help users examine specific details.
- BI reports: Often provide detailed records, tables, historical data, and analysis for a particular topic or period.
For example, a sales dashboard may show monthly revenue against a target, while a sales report provides a detailed breakdown of individual transactions.
The 3 main types of business intelligence dashboards
Businesses commonly use three types of business intelligence dashboards, depending on their objectives.
- Strategic Dashboards: Built for executives and department heads. They track macro health, long-term goals, and high-level KPIs (e.g., Annual Recurring Revenue, Customer Acquisition Cost, Net Profit Margin).
- Operational Dashboards: Designed for front-line managers and operators. They monitor real-time activity and daily performance (e.g., open support tickets, server uptime, daily fulfillment rates).
- Analytical Dashboards: Crafted for analysts and strategists. They emphasize complex data exploration, trend discovery, and hypothesis testing (e.g., multi-touch attribution, user cohort retention analysis).
Real-world BI dashboard examples and tools
Different Business Intelligence Solutions platforms support different dashboard requirements.
1. Executive financial performance dashboard
Platform: Microsoft Power BI
A financial dashboard can display revenue, profit margins, cash flow, and budget variances through KPI cards and trend charts.
Business value: Finance leaders can compare actual results with targets and identify departments or regions that need attention.
Design tip: Highlight changes against targets instead of showing totals without context. Explore examples in the Microsoft Power BI Data Stories Gallery.
2. E-commerce sales dashboard
Platform: Tableau
An e-commerce dashboard can track website traffic, conversion rates, average order value (AOV), and cart abandonment.
Business value: Marketing and sales teams can identify where customers leave the purchase process and improve the shopping experience.
Design tip: Use funnel charts to show conversion across different stages. Browse examples in the Tableau Public Gallery.
3. Digital marketing dashboard
Platform: Google Looker Studio
A marketing dashboard can combine advertising and website analytics data to track campaign spending, conversions, cost per acquisition (CPA), and return on ad spend (ROAS).
Business value: Marketing managers can identify high-performing channels and adjust campaign budgets based on results.
Design tip: Use consistent metric definitions when comparing advertising platforms. Explore the Looker Studio Report Gallery.
5 principles of effective dashboards and the metrics worth tracking
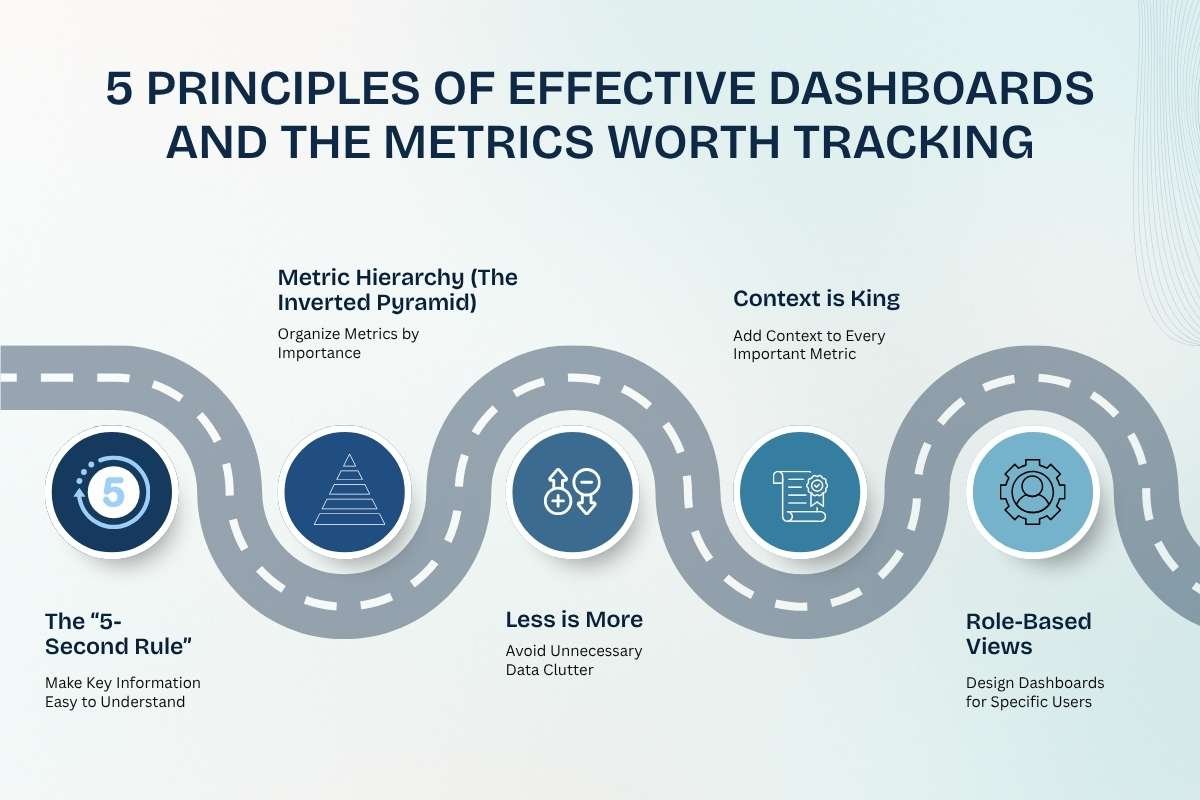
An effective dashboard presents important information clearly and helps users understand what requires attention.
Principle 1: The “5-second rule” – Make key information easy to understand
Users should be able to identify important metrics quickly. Use clear labels, simple charts, and consistent formatting. Do not rely on colors alone to communicate performance.
Principle 2: Metric hierarchy (the inverted pyramid) – Organize metrics by importance
Follow a clear visual hierarchy:
- Top: Core KPIs and performance summaries.
- Middle: Trends, comparisons, and supporting charts.
- Bottom: Detailed tables, filters, and drill-down information.
This structure helps users move from an overview to more detailed analysis.
Principle 3: Less is more – Avoid unnecessary data clutter
Too many charts and metrics can make a dashboard difficult to use. Start with five to seven core KPIs per view, then add supporting information when necessary. The appropriate number depends on the dashboard’s purpose and users’ needs.
Principle 4: Context is king – Add context to every important metric
An isolated number rarely explains performance. For example, revenue of $150,000 becomes more meaningful when shown alongside the target and previous month’s results.
Include historical comparisons, targets, and percentage changes so users can identify whether performance is improving or declining.
Principle 5: Role-based views – Design dashboards for specific users
Different teams need different information.
- Executives: Revenue, profitability, growth, and business targets.
- Sales teams: Pipeline value, conversion rates, and target achievement.
- Marketing teams: Campaign costs, conversions, and return on ad spend.
- Operations teams: Inventory, delivery times, and service performance.
Role-specific dashboards help users focus on the metrics most relevant to their responsibilities.
Essential KPI framework by business function
The right KPIs depend on business goals, industry, and operating models. Defining these metrics early forms a critical part of a successful Business intelligence strategy.
| Department | Core Metrics to Track | Primary Dashboard Goal |
|---|---|---|
| Executive Management | ARR/MRR, CAC, LTV, burn rate, net profit margin | Monitor growth and financial health |
| Sales | Win rate, pipeline velocity, sales cycle length, quota attainment | Track sales performance and forecast revenue |
| Marketing | ROAS, CPA, conversion rate, marketing-qualified leads (MQLs) to sales-qualified leads (SQLs) | Evaluate campaigns and manage budgets |
| Customer Support / Operations | First response time, customer satisfaction (CSAT), ticket resolution rate, inventory levels | Improve service and operational efficiency. |
(Note: Use metrics that match the department’s actual objectives. For example, ARR is more relevant to subscription businesses than to companies that do not use recurring-revenue models.)
How to build a BI dashboard step by step

Building a useful dashboard requires moving through structured stages rather than connecting a data source to a visualization tool. Follow these five steps.
Step 1: Start with questions, not data
Start by defining the decisions the dashboard should support.
Ask stakeholders which problems they need to solve, which metrics measure progress, who will use the dashboard, and what actions users should take when performance changes.
Step 2: Collect, clean, and prepare data
Gather information from relevant sources, such as CRM systems, financial software, databases, and marketing platforms.
Remove duplicate records, correct inconsistencies, handle missing values, and standardize metric definitions. ETL (Extract, Transform, Load) and ELT (Extract, Load, Transform) are common approaches to preparing data.
Reliable data preparation reduces reporting errors and conflicting results.
Step 3: Choose the right BI tool
Select a platform based on your team’s needs, technical skills, data sources, budget, and security requirements.
- Microsoft Power BI: Suitable for organizations using Microsoft products and services.
- Tableau: Offers interactive data visualization and analytical exploration capabilities.
- Looker: Provides governed data exploration and a modeling layer for defining consistent business metrics.
- Looker Studio: Supports visual reporting and connections with marketing and web analytics data.
- Metabase: Helps teams explore data and create dashboards with relatively little technical overhead.
Step 4: Create a simple layout and test it
Place important KPIs at the top, followed by supporting charts and detailed information. Use line charts for trends, bar charts for comparisons, and tables for detailed records.
Test the dashboard with its intended users. Confirm that they can locate important information, interpret the metrics, and identify the next action.
Step 5: Set up data refresh and security
Define how frequently the data should update based on business requirements.
Use access controls, such as row-level security where supported and appropriate, to restrict access to sensitive information. Also, validate permissions, refresh schedules, and data accuracy before releasing the dashboard.
Common business intelligence dashboards mistakes to avoid
Even a well-designed dashboard can fail if it does not meet users’ needs.
- Tracking irrelevant metrics: Focus on measures that connect to business objectives instead of displaying numbers simply because they are available.
- Using slow data queries: Review data models, queries, and refresh processes to reduce loading times.
- Ignoring mobile users: Make important metrics readable on smaller screens when employees need mobile access.
- Showing metrics without ownership: Assign responsibility for investigating significant changes and following up on issues.
- Ignoring data quality: Check for missing, outdated, or inconsistent information before users make decisions based on it.
- Overlooking user feedback: Review dashboard usage and ask users which metrics or features need improvement.
Future trends in AI and the next generation of business intelligence dashboards

BI dashboards are evolving as analytics platforms introduce more automation and AI capabilities.
- Conversational BI & Natural Language Querying (NLQ): Instead of manually configuring filters, team members can ask simple natural language questions like: “Show me customer churn by region for Q3.”
- Predictive & Prescriptive Analytics: Modern platforms are moving beyond historical summaries (“what happened”) to automated forecasting and AI-generated operational suggestions (“what will happen next and how to fix it”).
- Embedded Analytics: Dashboard insights are increasingly embedded directly inside daily SaaS workflow applications, such as CRM systems, Slack, or project management software, meeting users where they work.
Conclusion
A successful business intelligence dashboard isn’t defined by its visual complexity or the number of charts it contains. It is measured entirely by its ability to help your team make faster, smarter, and more confident business decisions.
To build a dashboard people actually use, focus on user questions first, keep designs clean and contextual, and continuously audit metrics to ensure they align with active business goals.
FAQs
Q1: What is the main difference between a BI dashboard and an Excel report?
A BI dashboard visualizes data from multiple sources, while an Excel report often focuses on spreadsheet-based analysis.
Q2: How many metrics should be included on a single BI dashboard page?
Start with 5–7 core KPIs per view to keep the dashboard clear and focused.
Q3: Which BI dashboard software is best for beginners?
Power BI, Looker Studio, and Metabase are suitable options for beginners.
Q4: How often should BI dashboard data be refreshed?
Operational dashboards may need frequent updates, while strategic dashboards can refresh daily or weekly.
Q5: Why do employees resist using new BI dashboards?
Cluttered layouts, slow loading, unclear metrics, and irrelevant information can reduce dashboard adoption.