
Businesses collect data from sales, customers, finance, and daily operations. The stages of business intelligence help turn this raw data into useful insights for better decisions.
The process covers data collection, preparation, storage, analysis, visualization, and continuous improvement. For example, retailers use BI to track sales, identify popular products, and manage stock efficiently.
This guide explains seven practical stages of business intelligence and how they help businesses improve performance.
What are the 7 stages of business intelligence?
The seven stages are business requirement planning, data collection, data cleaning and integration, data storage, data analysis, data visualization and reporting, and decision-making with continuous improvement.
1. Define business goals and requirements
The first stage is to identify the business problem and decide what information is needed to solve it.
Without a clear goal, teams may collect too much data or create reports that do not help decision-makers. Businesses should identify their key questions, performance indicators (KPIs), data sources, and expected outcomes before starting.
Example: PepsiCo used data analytics and machine learning to help its field associates identify which products stores needed to restock. Its goal was to improve store-level decisions by using sales and inventory information.
Key activities:
- Define business objectives.
- Select relevant KPIs.
- Identify the teams that will use the reports.
- Decide which data sources are required.
Result: A clear plan for the BI project.
2. Collect data from different sources

Once the goals are clear, the next stage is to gather relevant data. Businesses often store information across different systems, such as customer relationship management (CRM) software, sales platforms, accounting tools, spreadsheets, and website analytics.
BI tools bring the required information together so teams can study business performance from a broader view.
Example: Consumer goods company PZ Cussons used Microsoft Fabric and Azure Databricks to bring together data from different sources. The project focused on providing reliable sales, market share, and pricing information to support revenue growth decisions.
Key activities:
- Identify internal and external data sources.
- Connect databases, applications, and spreadsheets.
- Collect historical and current data.
- Check whether the data is complete and relevant.
Result: A combined set of raw data ready for preparation.
3. Clean and integrate the data
Collected data may contain duplicate records, missing values, outdated details, or different formats. Analyzing it without checking its quality can lead to misleading results.
In this stage, teams correct errors, remove duplicates, standardize formats, and combine related records. They may use extract, transform, and load (ETL) processes to prepare data for analysis.
Example: Global bakery company Grupo Bimbo built a data analytics system using Azure Synapse Analytics and Power BI. Its process cleans and organizes data from business applications, sales systems, and product catalogues before making it available for reporting. This helps sales teams work with consistent business information.
Key activities:
- Remove duplicate entries.
- Correct formatting and data errors.
- Handle missing values.
- Match related information across systems.
- Apply data quality and validation rules.
Result: More consistent and reliable data for reporting.
4. Store data in a central location

After cleaning and integration, businesses need to store data where authorized teams can access it for analysis. Common options include data warehouses, data lakes, and cloud-based data platforms.
The right choice depends on data volume, structure, security needs, cost, and business requirements. Access controls and governance also help protect sensitive information.
Example: Indian consumer goods company Marico adopted Azure SQL Data Warehouse to handle large volumes of business data. Microsoft reported that the move increased its data processing speed by more than 150%, helping it manage changing data volumes more efficiently.
Key activities:
- Choose a suitable storage platform.
- Organize data for reporting and analysis.
- Set access permissions and security controls.
- Schedule data updates and backups.
Result: Organized data that teams can access securely and consistently.
5. Analyze data to identify trends
Data analysis is where businesses begin to answer important questions. Analysts examine historical and current information to identify patterns, unusual changes, opportunities, and possible causes of business problems.
Depending on the goal, teams may use descriptive analysis, statistical methods, data mining, or forecasting. However, a pattern in the data does not automatically prove that one factor caused another.
When evaluating analytical approaches, understanding Business intelligence vs. business analytics helps teams decide whether to focus on historical reporting or predictive modeling.
Modern platforms increasingly integrate AI in business intelligence to automate pattern detection and anomaly alerts.
Example: PepsiCo used Azure Machine Learning to identify shopping patterns and generate store-level recommendations. During its initial US pilot, field associates received daily lists of priorities for the stores they visited, helping them decide which products needed attention.
Key activities:
- Track KPIs and business trends.
- Identify unusual changes and patterns.
- Investigate possible causes.
- Use statistical analysis where appropriate.
- Develop findings that answer the original business question.
Result: Evidence-based insights that support business decisions.
6. Create dashboards and reports
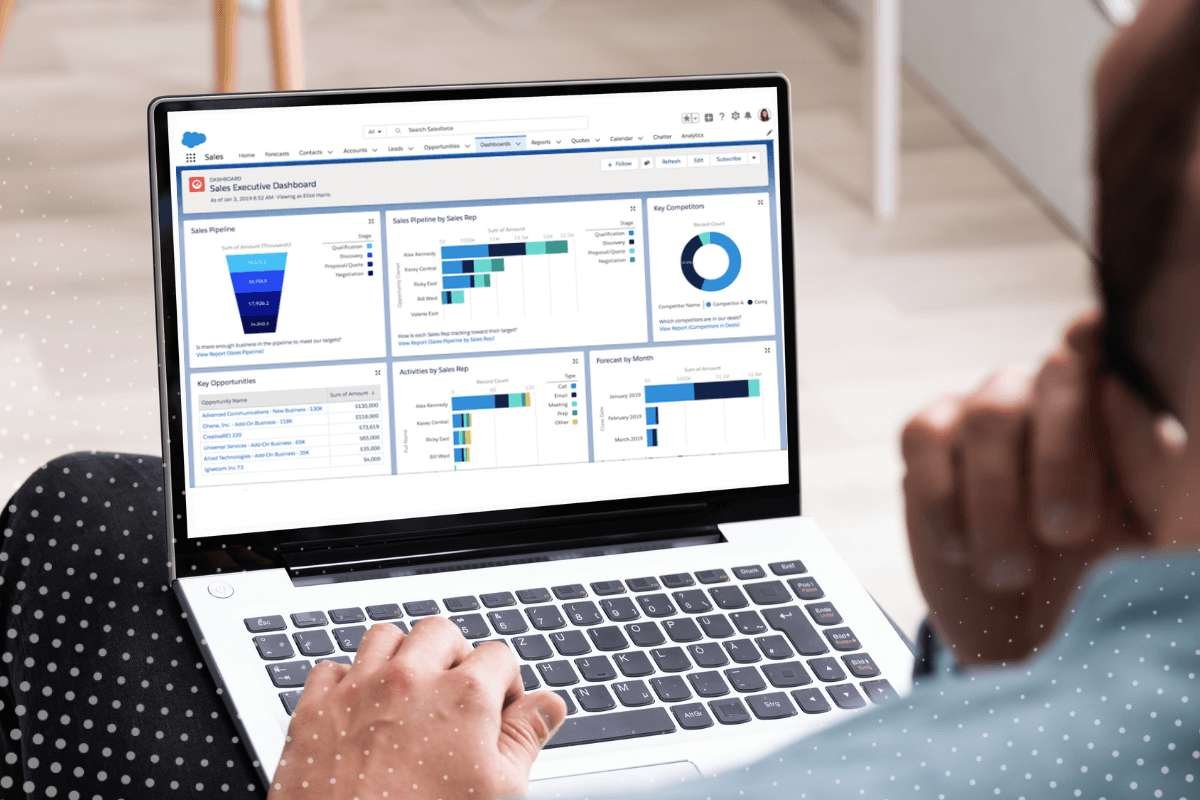
Analysis becomes more useful when teams can understand and act on the findings. In this stage, BI tools present results through BI dashboards, charts, graphs, tables, and reports.
A good dashboard highlights important information without overwhelming users. It should show relevant KPIs, time periods, targets, and changes in performance.
Example: Healthcare technology company Medtronic used Microsoft Power BI to bring thousands of separate dashboards into a centralized analytics system called INSIGHTS. The system served more than 45,000 operations and supply chain employees and helped automate over 240,000 hours of work.
Common BI tools include Microsoft Power BI, Tableau, and Qlik. The right tool depends on the company’s budget, data systems, reporting needs, and technical skills.
Key activities:
- Build dashboards and reports.
- Select suitable charts and visual formats.
- Highlight important KPIs and exceptions.
- Share reports with authorized users.
- Schedule updates where needed.
Result: Clear information that helps teams make informed decisions.
7. Make decisions and improve the process
The final stage is to use BI findings to take action. Businesses may change pricing, adjust inventory, improve marketing campaigns, revise budgets, or address operational problems.
The process does not end after a decision. Teams should track the results, measure progress against their goals, and improve their BI process when new questions arise.
Example: UK grocery retailer Iceland Foods adopted Microsoft Fabric and Real-Time Intelligence to gain faster insights into business performance. The company uses these insights to respond to customer trends and make data-informed decisions about promotions, inventory, and staffing.
Key activities:
- Turn insights into specific actions.
- Assign responsibility for each action.
- Measure results against the original KPIs.
- Review what worked and what did not.
- Update reports and analysis as business needs change.
Result: Measurable improvements and a BI process that keeps getting better.
Conclusion
The stages of business intelligence help companies turn raw data into reliable insights and practical decisions. The process starts with clear business goals, followed by data collection, cleaning, storage, analysis, reporting, and action.
Companies do not need to implement every stage using expensive software from the beginning. They can start with a clear business question, reliable data, and a simple dashboard, then improve the process as their needs grow.
The most important point is that business intelligence creates value when teams use accurate data to make decisions and measure the results.
FAQs
1. What are the stages of business intelligence?
The seven practical stages are business planning, data collection, data cleaning and integration, data storage, data analysis, visualization and reporting, and decision-making with continuous improvement.
2. How many stages are there in business intelligence?
There is no universally fixed number. Some frameworks use four main steps, while others use six or seven stages, depending on how they group planning, data preparation, and improvement.
3. Which stage of business intelligence is the most important?
Every stage matters, but data quality is essential because incorrect or incomplete data can lead to misleading reports and poor decisions.
4. Which tools are used in the business intelligence process?
Common tools include Microsoft Power BI, Tableau, Qlik, SQL databases, and data integration platforms. The choice depends on business needs, data sources, budget, and technical skills.
5. What is the final stage of business intelligence?
The final stage is taking action based on insights and reviewing the results. Teams measure performance against their goals and use feedback to improve future analysis.