
Businesses often store information across separate systems, making it difficult to get a complete view of performance. Sales, finance, customer, and operational data may show different parts of the business, but teams need a connected view to identify patterns and gaps.
Business Intelligence Solutions help connect these data points so teams can track performance, identify inefficiencies, and respond to changing business needs. This guide covers the role of data warehouses, ETL pipelines, BI system architecture, and key factors to consider when choosing a solution.
What are business intelligence solutions and how do they work?
Business Intelligence Solutions help businesses turn raw data into actionable insights using connected data systems, analytics, and reporting tools. They support decisions such as identifying underperforming products, controlling operational costs, and improving resource allocation.
BI systems work in five steps:
- Collect data: Gather information from websites, databases, sales systems, and business applications.
- Clean data: Remove errors, duplicates, and inconsistent records.
- Store data: Organize the prepared information in a data warehouse.
- Analyze data: Use BI tools to create reports, charts, and dashboards.
- Make decisions: Use the insights to improve performance and solve business problems.
For example, a retailer can combine sales and inventory data in a BI dashboard to identify best-selling products, track revenue, and avoid stock shortages. This helps the company make faster, data-based decisions.
How data warehouses support business intelligence solutions

A data warehouse is a central system that stores organized data collected from different sources for reporting and analysis.
Businesses often keep information in separate systems. Sales data may sit in one application, customer details in another, and financial records in a third. This makes it difficult to create reports that show the complete picture.
A data warehouse brings relevant information together in a structure designed for analysis. It can store historical data, helping teams examine performance over time.
For example, a company can use warehouse data to answer questions such as:
- How did sales change compared with last year?
- Which locations have the highest operating costs?
- Which products contribute most to revenue?
- How have customer orders changed over time?
How a data warehouse fits into a BI system
A typical structure looks like this:
Data Sources → ETL or ELT Pipeline → Data Warehouse → BI Tool → Reports and Dashboards
Each part has a clear role. Source systems provide the data, pipelines prepare or load it, the warehouse organizes it, and BI tools present the results.
A data warehouse does not automatically guarantee accurate reporting. Businesses still need clear data definitions, suitable access controls, quality checks, and regular maintenance.
What are ETL pipelines in business intelligence?
ETL stands for Extract, Transform, Load. An ETL pipeline moves data from its source, prepares it, and loads it into a target system, often a data warehouse.
It helps Business Intelligence Solutions work with data from multiple systems in a consistent way.
The three stages are:
- Extract: Collect data from databases, business applications, spreadsheets, or other sources.
- Transform: Clean, validate, standardize, and combine the data.
- Load: Place the prepared data into the data warehouse or another target system.
For example, a retail business may extract daily sales from several stores, standardize product codes, check for duplicate transactions, and load the cleaned records into its warehouse. The BI platform can then use that data to create a sales dashboard.
Some organizations use ELT instead. In this approach, they extract data, load it into a target platform, and transform it there. The best approach depends on the data platform, workload, security needs, and reporting requirements.
ETL pipelines also need monitoring. Failed data loads, outdated records, and incorrect transformations can affect dashboards and lead to poor decisions.
How business intelligence systems are structured
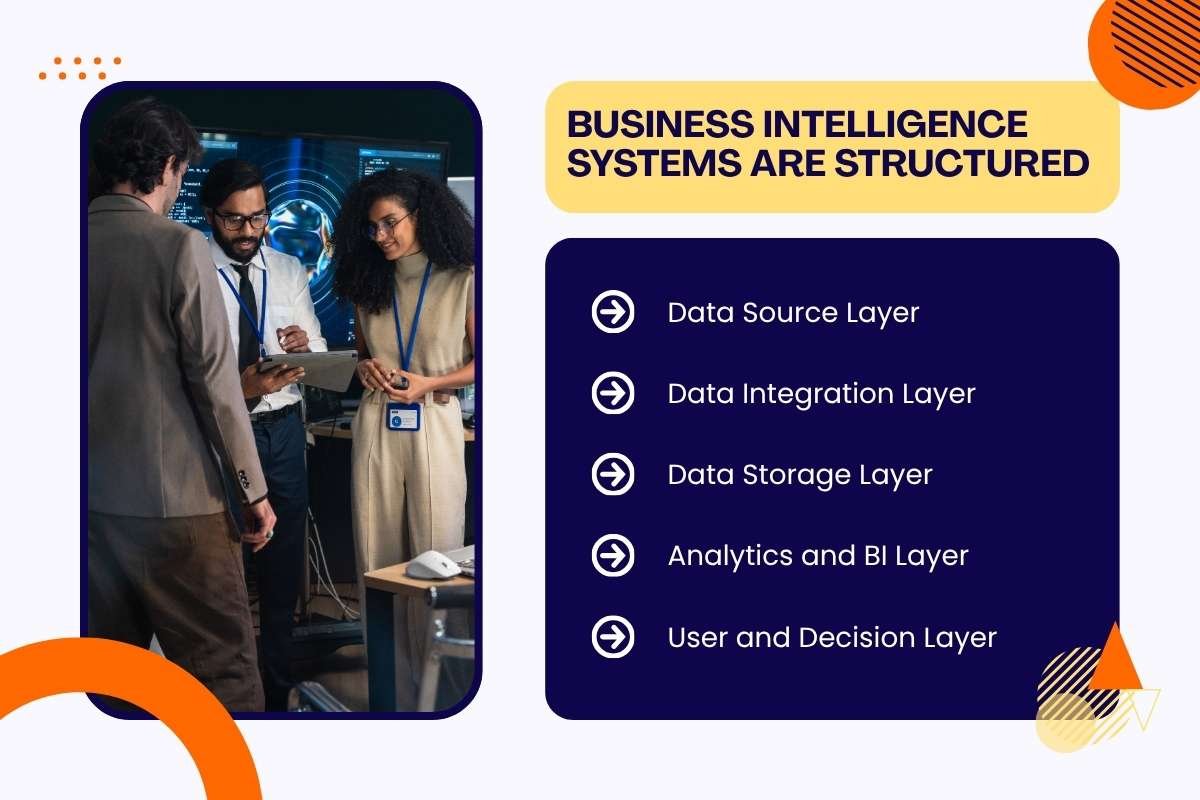
A BI system usually has several connected layers. The exact design varies with the size of the organization, its data needs, and the technology it uses.
- Data Source Layer: This layer contains the original data. Sources may include ERP systems, CRM platforms, spreadsheets, websites, transaction databases, and operational applications.
- Data Integration Layer: This layer moves data between systems. ETL or ELT pipelines clean, transform, validate, and load information for analysis.
- Data Storage Layer: This layer stores data in a data warehouse, data lake, or another suitable platform. The design depends on whether the company needs structured reporting, large-scale data storage, or both.
- Analytics and BI Layer: Tools such as Power, Tableau, and Looker connect to the prepared data. They help users create reports, dashboards, visualizations, and interactive analysis.
- User and Decision Layer: Employees, analysts, and managers use reports to monitor results and answer business questions. Access permissions help ensure that people see only the data they are authorized to view.
Security, data governance, and data quality support every layer. Organizations should also define key metrics consistently so different teams do not report conflicting numbers.
Real-world example of business intelligence
Medtronic uses Microsoft Power BI
Medical technology company Medtronic used Microsoft Power BI to improve access to operations and supply chain data.
According to Microsoft’s official customer story, the initiative supported more than 45,000 employees and helped automate over 240,000 hours of work.
Key takeaway: Centralized BI reporting can reduce manual work and help teams access consistent information.
How to choose the right business intelligence solutions
Before selecting a platform, businesses should identify the problems they want to solve.
- Define your goals: Decide whether you need better sales reporting, cost tracking, customer analysis, or operational visibility.
- Check your data sources: Confirm that the solution can connect to your existing databases and business applications.
- Review ease of use: Choose dashboards and reporting features that employees can use with suitable training.
- Check security: Look for role-based access, appropriate data protection, and audit features.
- Consider cost and scale: Review licensing, implementation, maintenance, and future data needs.
- Measure results: Track report preparation time, data accuracy, dashboard usage, and progress toward business targets.
Start with a focused use case rather than trying to connect every business system at once. A successful pilot can help the company identify data gaps, test user needs, and plan a wider rollout.
Conclusion
Business Intelligence Solutions help companies turn scattered data into useful reports and insights. Data warehouses provide organized storage, ETL or ELT pipelines prepare information, and BI (Business Intelligence) tools present results through dashboards and reports.
The real value comes from using accurate, relevant data to make better decisions. Businesses that define clear goals, maintain data quality, protect sensitive information, and measure outcomes can build BI systems that support better reporting and stronger operations.
FAQs
1. What are business intelligence solutions?
Business Intelligence Solutions turn business data into useful insights through analytics, reports, and dashboards.
2. What is the role of a data warehouse in BI?
A data warehouse stores organized data from multiple sources for consistent reporting and historical analysis.
3. What is an ETL pipeline in business intelligence?
An ETL pipeline extracts, cleans, transforms, and loads data into a target system for analysis.
4. What are the main components of a BI system?
The main components are data sources, integration pipelines, storage systems, BI tools, and reports or dashboards.
5. Which tools are used for business intelligence solutions?
Common BI tools include Microsoft Power BI, Tableau, and Google Looker.