
The quality of a product or a service is one aspect that we keenly look into when it comes to measuring performance. It is just there in everyday choices that we make. From a simple coffee to a complex automobile, if the quality is not up the par, we tend to evaluate the products by digging deep into the making of it. This justifies the significance of quality over anything. Talking in business terms, the market has become more competitive than ever. Quality control tools and efficiency are among the core elements that businesses and industries are in pursuit of. Businesses are under constant pressure to emerge as successful entities in this competitive landscape.
If you are on the verge of starting a business or already surviving in this competition, you must constantly work on the process of improvement. How do you do that? The concept of quality control tools (QC tools) comes into the limelight in this phase. This article will elaborate on what these tools are and how they make businesses evaluate their performance for better growth.
What Are Quality Control Tools?
The desire to create an exceptional product is natural. There is a possibility that it doesn’t turn out the way you expected. What will you do during such times? You look for the root causes. That is what exactly these tools are going to help you with. QC tools help businesses to identify recurring issues, root causes, and the repercussions associated with them. Quality control tools play a major role in eliminating issues, identifying areas for improvement, and preventing defects from happening in the first place. Additionally, QC tools help a business find out the root cause and increase the efficiency and productivity of products to meet the customers’ demands.
Now that you have a brief idea of these tools, let us discuss some tools that drive efficiency.
7 Most Commonly Used Quality Control Tools:
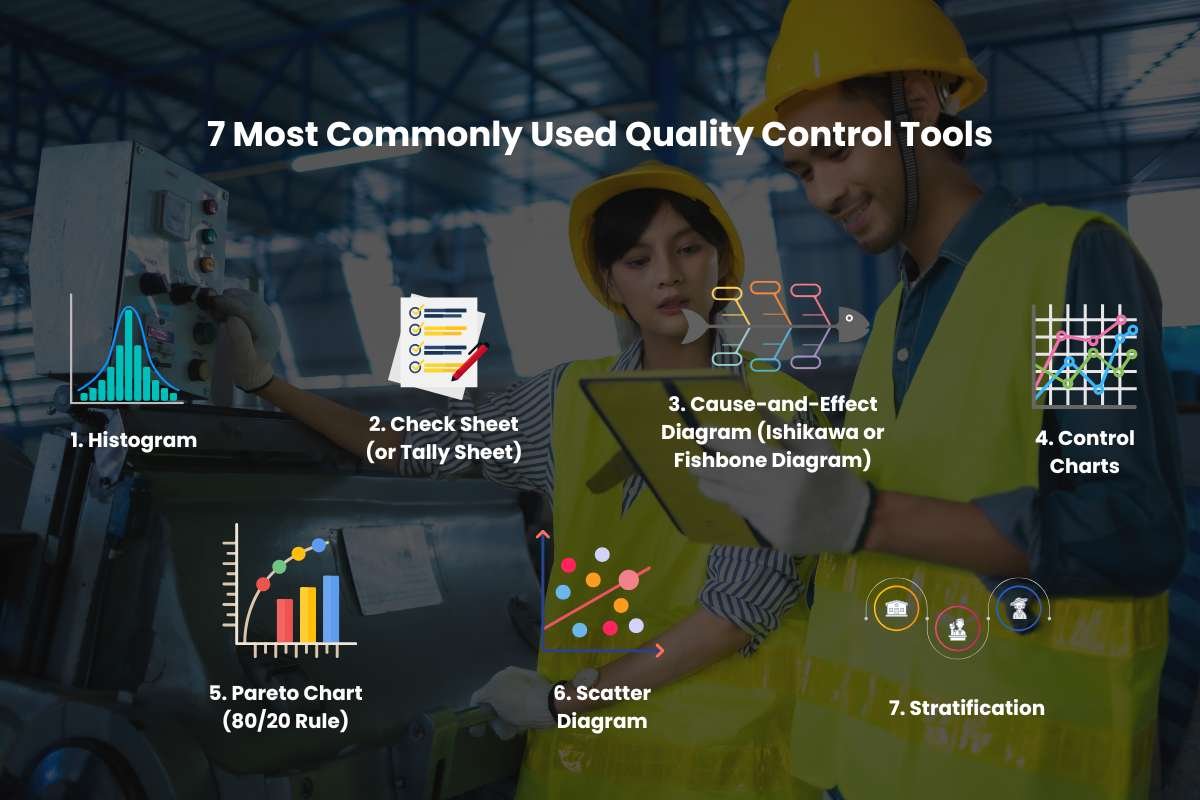
1. Histogram
A histogram is a statistical tool used in quality control to analyze and improve processes. Introduced by Karl Pearson in 1891, it visually represents the frequency distribution of data through bars, where each bar reflects a specific range or category, and its height shows how often data points fall into that range. Whether it’s analyzing product dimensions in manufacturing or tracking service delivery times in customer support, histograms provide insights that help your business identify issues, compare data trends, and make changes to improve processes.
2. Check Sheet (or Tally Sheet)
Check sheets are used to collect quantitative and qualitative data. A check sheet collects data using tally marks or checks to represent recurring values, making it easy to identify defects or errors in a system or process. It helps detect patterns of defects and understand the root causes, playing a crucial role in effective quality management. With its precise design and visuals, a check sheet simplifies the process of recording initial frequency distribution data. This data can then serve as a foundation for creating other quality tools, such as histograms and bar graphs, ensuring a smooth approach to process measurement and improvement.
3. Cause-and-Effect Diagram (Ishikawa or Fishbone Diagram)
Created by Kaoru Ishikawa, the cause-and-effect diagram is one of the major quality control tools designed to help teams systematically identify potential causes of a specific problem. With its fishbone-like structure, the problem is placed at the head, while the bones branch out into categories like Methods, Machinery, Materials, Manpower, Measurement, and Environment. It helps businesses find out the root causes rather than just focusing on obvious issues. For example, if a manufacturing company is dealing with declining product quality, the diagram can guide them to inspect causes like faulty equipment, untrained staff, inconsistent materials, or environmental factors.
Learn More: Understanding Financial Performance Indicators: Key Metrics for Business Success
4. Control Charts

Control charts are used to monitor how a process functions over time. These quality control tools allow businesses to visually track product variations and detect any patterns that may result in defects or issues in the process. Control charts are particularly useful for companies to identify problems early and make adjustments as needed.
5. Pareto Chart (80/20 Rule)
One of the most popular quality control tools, the Pareto Chart, helps identify the most significant issues that need immediate solutions. The 80-20 rule justifies that 80% of a system’s issues stem from just 20% of the primary causes. The remaining 20% of problems arise from 80% of the minor causes. This chart combines a bar graph and a line graph, with bars displaying individual values in descending order and the cumulative total represented by the line.
The purpose of the Pareto chart is to identify and prioritize the most significant factors affecting a process, helping you focus on the areas that will have the greatest impact. This tool helps businesses focus on addressing the major problems, which leads to significant improvements in product quality.
6. Scatter Diagram
A scatter diagram, also known as a scatter plot, is one of the key quality control tools. Like a fishbone diagram, it helps identify and understand the relationship between causes and their effect. For example, the variables X and Y represent those causes and effects. Businesses use scatter diagrams to analyze how these variables are connected. This makes it easier to look for issues and work toward solutions.
7. Stratification
Stratification is one of the effective quality control tools used to sort data into specific layers or categories. The goal is to identify patterns or issues that might be hidden when data gets merged. This tool is especially essential for identifying sources of variation or breaking down information for more detailed analysis. By dividing data into subgroups based on criteria like time, location, or specific attributes, stratification makes it easy to find the inefficiencies of a product.
Learn More: Best Enterprise Architecture Tools to Transform Your Business Operations in 2025
Benefits of Quality Control Tools

→ Improved quality of the product
→ Helps in identifying and analyzing problems in the process
→ Encourages teamwork
→ Provides greater efficiency with minimal waste
→ Helps in improving risk management
Learn More: Tools for Controlling Risk in Insurance
Conclusion
These days, quality is the revenue-driving factor. Businesses are under constant pressure to deliver great quality products to emerge as successful entities. Using quality control tools helps companies detect problems early, improve their processes, and meet customer expectations. These tools help businesses understand their operations better and find areas to improve.