Adding more staff to a lagging department might feel productive, but it often just masks deeper systemic waste. A logistics company struggling with order fulfillment discovers that hiring more warehouse workers fails to fix the real issue: a broken order-entry system.
Diagnosing those hidden bottlenecks requires value stream mapping, an operational framework that charts every step in a process to distinguish value-adding activities from costly delays. Uncovering true root causes stops executives from throwing resources at the wrong problems.
Targeting operational waste transforms fragmented workflows into cohesive, high-speed delivery systems. Modernizing process evaluation methods protects your bottom line and improves customer satisfaction.
In this article, we will take a look at what value stream mapping is and how it is used across industries. So, let us start by seeing exactly how it works.
How does value stream mapping work?
VSM works by giving teams a clear picture of how work moves through a process. It tracks the flow of materials, information, tasks, and decisions from the starting point to the final customer. This helps teams see where time, effort, and resources are being lost.
Step 1: define the value stream
Start by selecting the process you want to examine and clearly define its starting and ending points. Focus on a specific product, service, or customer journey rather than trying to map the entire organization.
Step 2: map the current state
Document how the process works today. Record each major activity, handoff, waiting period, decision, inventory point, and information flow. Include details such as processing time, waiting time, and work in progress where possible.
Step 3: identify waste
Review the current state map to find activities that do not add value for the customer. Look for delays, unnecessary movement, excess inventory, repeated work, bottlenecks, and avoidable handoffs.
Step 4: analyze the flow
Examine how smoothly work moves between each stage. Identify areas where work builds up or waits for approval, information, materials, or resources. This helps teams understand the main causes of delays rather than only treating their symptoms.
Step 5: create a future state map
Design a better version of the process based on the problems identified. The future state map should show how the organization can reduce waste, improve flow, simplify handoffs, and create a more consistent process.
Step 6: develop an improvement plan
Turn the future state into practical actions. Assign responsibilities, set priorities, establish timelines, and decide which improvements should be tested first.
Step 7: implement and review
Put the improvements into practice and measure their impact. Teams should continue reviewing the process because new bottlenecks or sources of waste can appear as conditions change.
VSM is not simply about drawing a process diagram. It provides a structured way to understand how work flows, find what slows it down, and build a practical path toward a more efficient process.
Types of value stream mapping
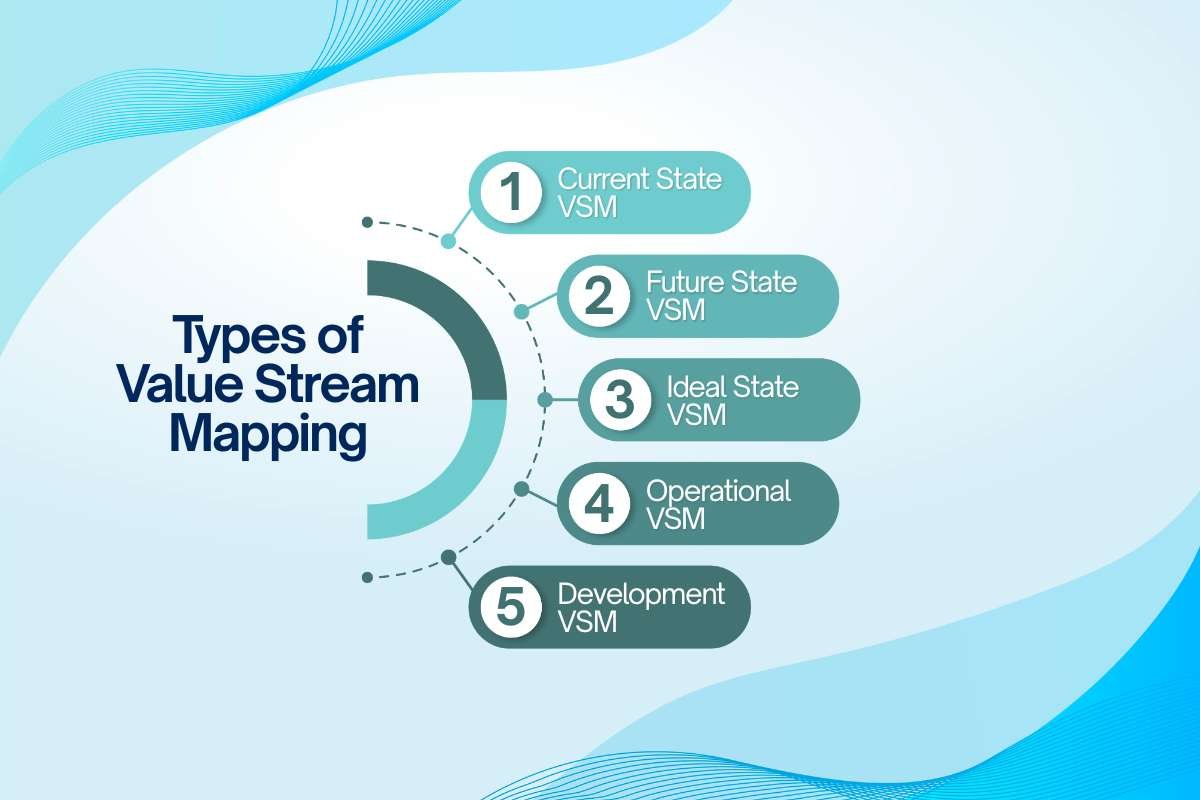
Value stream mapping can be classified based on the state of a process being analyzed and the area of work being mapped. The three operational states help organizations understand where a process stands and where it should go, while the two functional scopes apply VSM to different types of work. Together, these categories provide a practical way to structure process improvement efforts.
1. Current state VSM
A current state map shows how a process works right now. It captures the flow of materials, information, tasks, waiting periods, and handoffs across the value stream. Teams use it to identify waste, bottlenecks, delays, and other problems that affect efficiency and customer value.
2. Future state VSM
A future state map illustrates how the process should work after improvements are made. It removes unnecessary activities, reduces delays, and creates a smoother flow based on lean principles. Teams use this map to set improvement goals and develop an action plan for moving from the current state to a better process.
3. Ideal state VSM
An ideal state map represents the long-term vision for a value stream with minimal waste and maximum flow. It goes beyond immediate improvements and considers what the process could look like if major constraints were removed. Organizations can use it as a strategic benchmark for continuous improvement.
4. Operational VSM
Operational VSM focuses on the processes involved in delivering an existing product or service to customers. It can cover activities such as manufacturing, order fulfillment, healthcare delivery, customer service, or distribution. The goal is to improve the flow of work and resources while reducing activities that do not create customer value.
5. Development VSM
Development VSM focuses on how an idea, requirement, or project moves through development and delivery. It is commonly used in product development, software engineering, and innovation processes. Mapping these workflows can reveal delays in planning, approvals, testing, decision-making, and handoffs between teams.
What are the benefits of value stream mapping?
VSM gives organizations a clear view of how work moves from start to finish. Instead of looking at individual tasks in isolation, teams can see how different activities connect and where problems affect the wider process. This makes it easier to find waste, improve flow, and focus improvement efforts where they can have the greatest impact.
1. Identifies process waste
VSM helps teams spot activities that consume time or resources without adding value for the customer. Unnecessary movement, excess inventory, repeated work, delays, and extra approvals become easier to identify when the entire process is visible.
2. Reduces process delays
Mapping each stage reveals where work spends the most time waiting. Teams can identify bottlenecks, slow handoffs, and approval delays, then make targeted changes to improve cycle times and keep work moving.
3. Improves process flow
A value stream map shows how smoothly materials, information, and tasks move between stages. By removing unnecessary steps and improving coordination, organizations can create a more consistent flow with fewer interruptions.
4. Improves resource utilization
VSM helps organizations understand how people, equipment, materials, and other resources are being used. This can highlight areas where resources are overloaded, underused, or tied up by inefficient processes.
5. Supports better decision-making
A visual representation of the process gives teams a shared source of information when evaluating improvements. Instead of relying on assumptions, managers can use process data to determine where changes are needed and which problems should receive priority.
6. Enhances customer value
The main purpose of VSM is to improve the activities that create value for customers. Removing unnecessary work and reducing delays can help organizations deliver products or services faster, more consistently, and with fewer errors.
7. Challenges in implementing value stream mapping

Although value stream mapping can reveal major opportunities for improvement, creating and using a VSM is not always straightforward. Teams may face problems with data quality, employee participation, process complexity, or resistance to change. Understanding these challenges early can help organizations plan more effectively and avoid turning VSM into a purely visual exercise.
- Lack of accurate data
A useful value stream map depends on reliable information about processing times, waiting periods, inventory, defects, and other process measures. Inaccurate or outdated data can create a misleading picture of the workflow and lead teams toward ineffective improvements.
- Employee resistance
Employees may feel that process mapping is being used to monitor their performance or eliminate roles. This can make people less willing to share information about problems. Clear communication and employee involvement can help build trust and encourage honest participation.
- Difficulty mapping complex processes
Some processes involve multiple departments, systems, suppliers, or customer interactions. Trying to capture every detail can make the map difficult to understand and reduce its usefulness. Teams need to define an appropriate scope before beginning the exercise.
- Limited management support
VSM often identifies problems that require changes in resources, policies, technology, or workflows. Without support from management, teams may struggle to implement the improvements identified through the mapping process.
- Focusing only on waste
Lean principles place strong emphasis on eliminating waste, but focusing only on removing activities can overlook quality, employee needs, customer expectations, and process stability. Improvements should reduce waste while preserving the activities that genuinely create value.
Value stream mapping examples across industries

VSM can be applied to almost any process where work, information, or resources move through multiple stages. The following examples show how organizations in different sectors can use VSM to identify waste, improve flow, and create more efficient processes.
Manufacturing: improving production flow
Consider an automobile manufacturer mapping its process from raw material intake to finished vehicles. The map may reveal excess inventory, long setup times, production bottlenecks, or delays between different stages of manufacturing.
With these issues identified, the company can introduce lean practices such as just-in-time inventory, SMED techniques for faster changeovers, and Kanban systems to better control production needs. These changes can reduce lead times, minimize waste, and create a smoother flow across the production process.
Healthcare: improving patient flow
A hospital emergency department can use value stream mapping to examine the complete patient journey, from registration and triage to treatment and discharge. Mapping each stage can highlight long waiting periods, unnecessary handoffs, communication gaps, and inefficient use of staff or resources.
The hospital can then introduce standardized work procedures, cross-train employees, and monitor patient flow in real time. These improvements can help reduce overcrowding and waiting times while allowing staff and resources to be used more effectively.
Service industry: improving customer support
A customer service call center can map the process from the moment a customer makes contact to the final resolution of their issue. The map may uncover repeated tasks, unnecessary transfers between departments, or delays caused by limited access to customer information.
To improve the process, the organization could introduce self-service options for common questions, expand employee training, and use centralized case management tools. These changes can shorten response times while creating a more consistent experience for customers.
Beyond these examples, value stream mapping is also widely used in supply chain management, office administration, software development, and IT operations. These applications allow organizations to examine information flows, approvals, deliveries, and digital workflows in the same way they analyze physical production processes.
Conclusion:
Relying on quick fixes to speed up work often hides the real bottlenecks in your business. Using value stream mapping gives your team a visual, step-by-step blueprint to spot hidden delays, cut out wasted effort, and track how work flows from start to finish.
When companies strip away unnecessary handoffs, processes move faster, and costs go down. Investing in clear process maps helps your business deliver better results to customers while keeping operations lean and efficient.
FAQs
1. What is VSM?
It is a lean management method used to visually chart every step in a process to identify waste and improve workflow efficiency.
2. What is the main goal of VSM?
The main goal is to separate steps that add real value to the customer from non-value-added delays that waste time and money.
3. How does VSM differ from a regular process flowchart?
A process flowchart simply lists steps, while a value stream map includes detailed operational data like cycle times, delays, and information flow.